Showing posts with label social network. Show all posts

Monday, May 25, 2015

5 Types of Businesses That Are Copying the Uber Model

If we’ve learned anything about successful business models in the wake of Uber’s exploding market share, it’s that convenience is king. Despite an onslaught of bad press and the growing pains of creating a company valued between $40-50 billion in just six years, Uber is without a doubt making its mark. On the heels of its great success, other entrepreneurs are lining up to see if they can create their own version of on-demand service that cuts out middle men and makes errand running as simple as opening an app on your smartphone.
By creating the mold for the concierge service industry, Uber has now become synonymous with the idea of at-your-doorstep convenience for completing a multitude of household tasks and daily chores. If you don’t want to walk your dog or finish the list of jobs you have for that day, there’s surely an app that can help you get it finished — or there’s one in the works in the depths of Silicon Valley.
Uber maintains it’s not a car service, it’s a technology company that happens to use its platform to provide people with instant access to a taxi alternative in the cities in which it operates. Whether that’s a company vision plan or just a way to get around transportation regulations in countries like India remains to be seen, but regardless, we’re now at the point where other startups are aiming to be the “Uber of X,” where “X” is any other delivery, concierge, or general errand service.
These types of services fit well into tech hubs like Silicon Valley, where “disruptive innovation” (that upends old systems with new technology) is paramount, The Guardian notes. The quest for disruptive innovation replaced manual labor with the cotton gin, substituted letters with email, and now is likely to completely change the ways people with smartphones — and a penchant for convenience — complete numerous tasks in their daily lives. Here are five industries that are already starting to see an onslaught of apps to help people in their daily lives. They’re not always cheaper than the standard method, but they often save time or at least make life a little simpler. Now, it’s an individual question of whether that’s worth it.
Source: iStock

1. Laundry

Just as parents sometimes sign their college children up for wash ‘n’ fold services that pick up laundry and return it clean and folded, there’s now numerous apps that ensure you never have to touch a dirty sock again for all of adulthood, if you wish.
FlyCleaners, which operates right now in Brooklyn and Manhattan, will have someone pick up the laundry right from your doorstep, and return it to you within less than 24 hours. (If pickups happen before 11 a.m., it’s ready by 7 a.m. the next day.) Pickup and delivery happens from 6 a.m. until midnight daily, seven days a week. The company also offers dry cleaning services. According to estimated pricing from Manhattan ZIP codes, laundry will cost about $1.25 per pound of clothing, with individual pricing on special items like pressed shirts ($2.50 each) and dress or suit cleaning ($12 each). The company also allows you to customize how you’d like your laundry finished, down to the amount of starch or if you’d like to use bleach for an extra cost.
Washio, perhaps a larger name in the industry because it operates in six major cities (Chicago, Boston, Los Angeles, Oakland, San Francisco, and Washington, D.C.), also offers “on demand” services and delivers laundered clothing within 24 hours of pickup, right from your door. Wash and fold services (mostly for t-shirts or jeans) is about $1.39 per pound, with varying prices for blouses ($4.99), dresses ($8.75), coats ($12.99) and more. Minimum orders are $20, with a surcharge of $3.99 for orders less than $35.
This is one of the cases when convenience will have to be more important than cost, as Geoffrey A. Fowler, who tested several concierge apps for the Wall Street Journal, noted. “Washio charged me $1.60 per pound of laundry plus a delivery fee; I could have done it for a little less by bringing the hamper to a wash and fold, or a lot less by doing it myself,” he wrote. Despite the price it seems to be catching on, as TechCrunch reported in February the company has raised more than $13 million in funding.
Source: Shyp

2. Shipping

For individuals and businesses alike, shipping is one of the great logistical headaches. Now, apps are starting to creep up that eliminate your trips to the post office or nearby FedEx, UPS, or DHL site. Shipster is one of them, and basically requires people to take a picture of the item they’d like to send (from a card to a desk chair, and more), and their address plus that of the destination. A ‘Shipster’ arrives at your doorstep and takes the item, packaging it and sending it on its way to anywhere around the world. The app is live in Brooklyn and Manhattan with apparent plans to expand soon, though CEO Christian Vizcaino didn’t mention where in his interview with AlleyWatch in September 2014.
Another similar app is Shyp, which operates in New York City, San Francisco, Miami, and is in beta testing in Los Angeles. Fowler, of the Journal, said that the service picked up a package and shipped it for a fee of $5, for a total cost of about $48 for the shipment. The company negotiates bulk rates with carriers like UPS and FedEx, and the total was about what Fowler would have paid if he had gone to a shipping center and packaged it himself, he said. Both services are rated highly in Apple’s App store at 4.5 stars, though Shyp has had much more user feedback (a total of almost 250 reviews compared to Shipster’s 37).
Source: Luxe

3. Valet services

Finding a decent parking spot can be a pain in any city, a problem if you’d like to maintain the freedom of having your own car. Of all the apps Fowler used over the course of a week, the GPS-powered valet service Luxe was his favorite. The company operates in San Francisco, Los Angeles, and Chicago, and has plans to expand to Seattle and Boston. The service works much like a normal valet, with a few added perks. You let the company know via its app where you’re going to be. A valet picks up your car (and will even wash it or fuel it up for you, if you’d like), and then can return it to any spot within its service area — even if it wasn’t originally where you dropped off the car.
Fowler called the company a “marvel” of logistics, as the app tracks where you’re going so the attendant meets you at your destination at exactly the right time. (Fowler added that each of the attendants are fully vetted, trained, and insured.) The service for the entire day cost Fowler just $15 plus $3 in tip money, much less than the $35 he would normally pay for parking in his own building. That’s largely because the company negotiates better rates with underused parking garages around the city, Fowler explained. The only downside to this, he said, was that the company closes by 6 p.m. on Sundays — other days it’s open until 11 p.m. or midnight.

Source: Thinkstock

4. Health

True to the plot lines of Royal Pains, the idea of concierge medicine is one that immediately evokes images of living in the Hamptons with too much money to bother waiting in an overcrowded waiting room to see a doctor. The cost alone to get personalized care from a doctor used to put the idea of concierge medicine out of reach for most people. But with the rise of some medical apps, that’s not the case as much anymore. One Medical Group has an app that allows people to make doctor’s appointments and request prescription refills at the touch of a button, while also gaining email access to your doctor. One Medical operates in San Francisco, New York City, Washington, D.C., Boston, Chicago, Los Angeles, and Phoenix, and works with most insurance providers. The San Francisco Business Times reports that the annual fee to use the service in the Bay Area is $149, and is an employee benefit offered to those working for Twitter, Airbnb, Pinterest, Adobe, and more.
Another app that is reinstating doctors’ house calls is Heal, which is operating in Los Angeles and San Francisco. The company claims it will have a well-trained doctor to your doorstep in less than an hour from placing a request on the app, with a flat $99 fee per visit. The staff vary in their specialties from pediatric medicine to cardiology — the doctor that arrived on Fowler’s doorstep during his weeklong app tests studied at Stanford. The fee truly is $99, Fowler attested, and didn’t accept his insurance. It might not be Hamptons level, but there’s still definitely a cost for the convenience.

Source: Munchery.com

5. Meal preparation

Nothing gives you a range of possible apps to use quite like the food and meal preparation industry. AmazonFresh and others deliver foodstuffs to your door, sometimes without a delivery fee if orders reach a certain value. Instacart, which operates in about 15 national locations including San
Francisco, Philadelphia, Boston, and Chicago, is gaining lots of attention not only for its to-your-door convenience, but also for the quality of foods (especially produce) shoppers select for clients. “Our service is available to anyone who can afford our $3.99 delivery fee,” Apoorva Mehta, CEO of Instacart, told the San Francisco Business Times. The service shops at a variety of stores including Costco, Safeway, and Whole Foods, they reported, and tried to match in-store product prices, though there’s sometimes a mark-up on items like gallons of milk. The company has raised $220 million at a $2 billion valuation, the publication reported in January.
But for those who want more than the raw ingredients delivered to their doorstep, there’s a growing number of apps that will deliver hot meals for your dinner. Munchery operates in San Francisco, New York, and Seattle, and offers custom dishes from on-staff chefs including peppercorn crusted steak ($11.95 per plate), vegetarian pasta with mushrooms, peppers, and fresh pesto ($8.95), and gremolata baked salmon ($11.50). The company also contributes to local food banks for every meal purchased. Delivery is free for every meal with a $39 annual charge, the Business Times reports. Munchery is one of dozens now in the meal delivery game — others also in contention are Postmates, SpoonRocket, Caviar, and Blue Apron.

These Are the Most Popular Web Browsers Today

You’ve probably tried several web browsers and have determined which one is your favorite. But have you ever wondered which are the most popular web browsers among Internet users? You might be surprised to learn that Microsoft’s infamous Internet Explorer is still the most popular option, but Google’s Chrome is gaining users quickly.
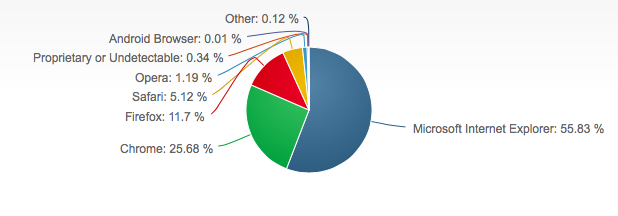
VentureBeat’s Emil Protalinski reports that April saw the naming of Microsoft Edge, the release of Chrome 42, and the first full month of Firefox 37 availability. Between March and April, Google Chrome finally passed the 25% user share milestone, according to Net Applications, which uses data captured from 160 million unique visitors to about 40,000 websites. As Computer World’s Gregg Keizer notes, user share acts as an estimate of the percentage of the world’s Internet users who ran a specific web browser during a given month.
The latest figures from Net Applications show that Internet Explorer’s market share fell by 0.71 points to 55.83%, while Chrome’s market share rose 0.69 points to 25.68%. Firefox’s market share fell 0.19 points to 11.70%. Safari’s market share rose 0.12 points to 5.12%, and Opera’s market share rose 0.05 points to 0.48%.
Source: Netmarketshare.com
Protalinski reports that while Internet Explorer’s market share fell overall, there was still good news for Microsoft’s browser. The latest version of Internet Explorer, IE11, grew 0.82 percentage points while IE10 and IE9 slipped 0.17 and 0.21 percentage points, and IE8 fell 1.26 percentage points. Among even older versions of Internet Explorer, IE7 gained just 0.03 points to reach 0.37%, and IE6 fell 0.06 points to 0.92%. In October, IE11 passed IE8 to become the world’s most popular browser, and the gap between them continues to widen.
The trend toward adoption of the latest versions of Internet Explorer was catalyzed by the loss of significant market share by Windows XP, whose users can’t upgrade past IE8. (As of January 2016, Microsoft will support IE9 only on Windows Vista and Windows Server 2008, IE10 only on Windows Server 2012, and only IE11 on Windows 7, Windows 8.1, Windows Server 2008 R2, Windows Server 2012 R2, and Windows 10.) Protalinski notes that IE11 can now grow “unchallenged” until Microsoft’s new browser, Edge, arrives.
As is typical with Google Chrome, older versions of the browser continued to lose market share as Chrome 42 gained market share. Chrome 41 slipped 1.80%, Chrome 40 fell  by 5.56 percentage points, and even older versions lost market share as users adopted the newest version.
Meanwhile, Mozilla’s Firefox has continued to hit new lows for months, but its built-in upgrade system consistently sees users upgrading to newest versions of the browser. Firefox 37 gained 6.12 percentage points to hit 6.45%, while Firefox 36 dropped 5.24 percentage points and Firefox 35 fell by 1.21 percentage points.
Keizer reports that Mozilla’s Firefox reached the 25% user share milestone that Chrome just achieved in November 2009, when its user share was just over 25%. Firefox held onto that user share for a month, dipped under it, and then regained it again in March and April 2010, when it peaked at 25.1%. After that, Keizer notes, Firefox went into “more or less permanent decline.”
Mozilla’s position in the browser marketplace is growing increasingly tenuous, and in the last 10 months, Firefox has lost more than 5 percentage points. The biggest benefactor of Firefox’s losses has been Chrome, which has gained 7.8 percentage points in the past year, representing an increase of 47%.
As Business Cheat Sheet reported recently, Civic Science surveyed 1,287 adults in April to figure out what consumers’ preferences in Internet browsers say about them. Among the users that Civic Science surveyed, Google Chrome was the top web browser choice, followed by Internet Explorer, with 37% reporting that Google Chrome is their browser of choice, 29% choosing Internet Explorer, 21% picking Firefox, 10% favoring Safari, and 4% reporting that their favorite Internet browser was one other than the choices offered.
The report found that Google Chrome is the top choice of millennials who keep up with the latest trends and new products, while Internet Explorer is the browser of choice among older individuals, who have grandchildren and a high rate of home ownership.
The users who prefer Mozilla’s Firefox fall somewhere in between the characteristics of Chrome and Internet Explorer fans, and based on the smaller amounts of data gathered on those who prefer Safari, they tend to align more closely with Chrome users and skew younger and slightly more female.

Why Your Password is Hackerbait (Infographic)

Another day, another warning of potential password pitfalls. Is it just us or do the days of handwritten letters and carrier pigeons seem to be increasingly appealing?
We recently wrote about the fact that people are still using terrible passwords. The passwords themselves are just the beginning. A new infographic compiled by password-management firm Meldium shows some interesting (read: frightening) statistics on how our online behavior is leaving us vulnerable to cyberthieves.
Did you know, for instance, that 90 percent of employee passwords can be cracked in six hours? That’s less than a full work day! Moreover, nearly two-thirds of people use the same password for their many different accounts. Imagine if whomever you shared your Seamless account password with also had your online banking password. Not a pleasant thought.
The infographic below offers a look at the common ways of keeping track of various passwords, and how often people forget the magic word or phrase for a site.
Click to Enlarge
Why Your Password is Hackerbait (Infographic)

Black Friday’s Record Online Sales

The new challenge facing brick-and-mortar shops this holiday season seems to be the increasing presence of e-commerce in consumer’s daily lives. Retailers like Macy’s(NYSE:M), Target (NYSE:TGT), Wal-Mart (NYSE:WMT), and Best Buy (NYSE:BBY) made plans early this season to stave off competitors such as Amazon.com (NASDAQ:AMZN) and other e-retailers, which, unlike brick-and-mortar stores, have one distinct advantage: their doors never close.
Last year, online sales accounted for a full 40 percent of the $59 billion in sales amassed over the Black Friday weekend in 2012, and those numbers, paired with lethargic store traffic in the brick-and-mortar sphere mean that the pressure is on to lure customers into the shops. The pressures aren’t set to go away, either, with a recent Nielson survey estimating that just over 50 percent of shoppers are planning on buying something over the internet this year, a statistic up more than 10 percent from last year, compared to just 48 percent of consumers who said they were planning on visiting a “big box” store during this year’s biggest holiday shopping weekend.
As a result, Macy’s opened on Thanksgiving this year for the first time ever, and other chain retailers have begun offering Black Friday deals earlier in the day Thursday, or utilizing tactics to get customers through the door, such as keeping deals hidden until consumers set foot in store, and only unveiled at a specific time, a strategy employed by Best Buy this year. This strategy aims to prevent other retailers from matching or beating their prices, in addition to luring customers in store. Other retailers put more of their deals on the web, so as to better compete with online retail giants.
However, despite their best efforts to keep up with e-commerce Goliath Amazon.com, online sales of brick-and-mortar companies Target and Wal-Mart still only account for about 2 percent of overall sales. Both Target and Wal-Mart are planning on investing more heavily in technology over building new locations, and this year, Target made nearly all of its Black Friday discounts available online as well as in-person, a change from previous years.
On the flipside, Amazon.com has developed its own strategies for beating out its old-school competition. In the past, the company offered discounts in the days leading up to Black Friday, and this year it added new deals every 10 minutes in order to more effectively keep customers attention. With the Black Friday weekend wrapping up,Disney (NYSE:DIS) Retail’s vice president, Paul Gainer, is reporting in-line brick-and-mortar sales, but higher-than-expected online sales, a trend that seems reflected in the aforementioned investments in online technology on the part of stores like Target.
The bottom line seems to be that online retail is flourishing, and brick-and-mortar companies will need to effectively address the growing trend towards online sales if they hope to profit in the wake of e-commerce gurus like Amazon andeBay (NASDAQ:EBAY).

Will Hackers Change Your Holiday Shopping Habits?

‘Tis the season to be careful with your wallet and personal information. Over the past year, data breaches at major retail stores have captured the attention of Americans. Privacy concerns are not a new issue in the digital age, but the negative exposure may be changing shopping habits this holiday season.
Nearly half of shoppers using plastic say they’re reluctant to return to stores that have been hacked. According to a new survey from CreditCards.com, 45% of respondents with credit or debit cards say they would “definitely” or “probably” avoid one of their regular stores over the holidays if that retailer experiences a data breach. In fact, 48% say security breaches make them more likely to pay with cash. Only one in eight shoppers say they are more likely to shop with credit cards this season.
Several big-name retailers have recently experienced data breaches. Target, the second-largest discount retailer in the United States, had a data breach in December 2013. In August, the company announced the breach cost $148 million in the second quarter, partially offset by a $38 million insurance receivable. Last month, Home Depot confirmed reports that its payment data systems were breached, potentially affecting customers using payment cards at its U.S. and Canadian stores. Even Dairy Queen was hacked, compromising software systems at approximately 400 locations.
A variety of factors appear to cause shoppers to be more sensitive to data breaches than others. The survey finds that only 31% of those in households earning $75,000 or more annually said they would “definitely” or “probably” avoid retailers who experienced a data breach, compared to 56% of those in households earning less than $30,000 a year. Similarly, respondents with higher levels of education are less likely to avoid stores that have been hacked.
The type of retailer also affects how shoppers react to data breaches. “A retailer such as Target where consumers have other options for shopping might lead people to shop elsewhere. But if a building contractor has a business account at Home Depot, he won’t necessarily go elsewhere after a breach,” said Jeff Foresman, information security compliance lead at Rock Security.

Saturday, May 23, 2015

See How Much Money Your Social Networks Make Off of You

If you’re like many Americans, you probably use several social networks regularly, checking in on your smartphone, tablet, or computer to see the links your friends have posted, the photos they’ve uploaded, the videos they’ve shared, and the witty tweets and statuses they’ve penned during their spare moments. But have you ever wondered how many dollars you’re making for Facebook or Twitter when you spend all of that time with their apps and websites? And how much do you make for LinkedIn when you’re networking, or for Yahoo when you scroll endlessly through your Tumblr dashboard? And in turn how much those sites are worth because of you?
We’ve done some basic math to figure out how valuable your social media use is to the companies behind your favorite social networks. To figure this out, we looked at two numbers: the revenue each social network generates, and the size of its user base, using figures from the end of 2014 wherever possible. This yields a rough estimate of how many dollars the average user generates for the company. Most social networks rely on advertising for the vast majority of their revenue. But some, like Facebook and LinkedIn, also generate revenue by charging users for games or premium services. Calculating based on total revenue (not just advertising revenue) helps to take these other user-dependent revenue streams into account.
Find out how much you’re worth to these five social networks: Facebook, LinkedIn, Twitter, Instagram (owned by Facebook), and Tumblr (owned by Yahoo).
So let’s say that you use only Facebook for your social networking needs. You made $8.97 for the social network last year. But if you use Facebook to connect with your friends, and LinkedIn to connect with colleagues and network with others in your field, you made $15.31 for the social networks last year. Add in Twitter, and you’re up to $20.17. And if you use all five social networks, you made $22.74 for these social media companies all by logging in, posting and liking content, reading articles, and perhaps occasionally clicking on an ad.
There are a couple of caveats with this method. This kind of basic calculation assumes that all users are the same, while we know for a fact that your location, level of activity, how many friends you have, and what you do on the social network have a big impact on how much revenue you actually generate.
Even your gender has an impact on how valuable you are to your social networks. Additionally, your level of engagement with articles that Facebook links to or with Tumblr’s promoted posts also changes the dollar value a company could put on your usage. And whether you access your social networks of choice from your smartphone or on a desktop will also determine how valuable you are as a user.
How did we arrive at these numbers again? Facebook’s total revenue in 2014 was $12.47 billion, and it had 1.39 billion monthly active users as of December 31, 2014, according to its fourth quarter 2014 results. Facebook’s advertising revenue for 2014 was $11.49 billion (and Ad Age reports that Facebook is selling fewer ads but charging much higher prices for them than it has in the past). When we divide $12.47 billion by Facebook’s 1.39 billion users, we arrive at a revenue of $8.97 per user.
LinkedIn’s total revenue in 2014 was $2.22 billion, and it had 347 million members (though it didn’t specify how many are active users of the social network) according to its 2014 financial report. Ad Age reported that LinkedIn’s ad revenue for 2014 reached $454.5 million. Dividing LinkedIn’s $2.22 billion in revenue by its 347 million members, we get a revenue of $6.34 per member.
Twitter’s revenue in 2014 was $1.4 billion, according to its fourth quarter results. A document on company metrics and financials disclosed that in 2014, Twitter had 288 million monthly active users and earned $1.25 billion in advertising revenue. (Twitter also reported that timeline views reached 182 billion for the fourth quarter of 2014, an increase of 23% year-over-year, and advertising revenue per thousand timeline views reached $2.37 in the fourth quarter of 2014, an increase of 60% year-over-year.) Dividing Twitter’s $1.4 billion by its 288 million active users, we arrive at a revenue of $4.86 per user.
Facebook doesn’t report specific figures for Instagram. But in December 2014, Instagram announced in a blog post that it had reached 300 million users. In February, Cowen & Co. analysts projected that Instagram will generate about $700 million in revenue in 2015 (and $5.8 billion in revenue in 2020), according to Mashable. The same analysts say that Instagram is worth about $33 billion. Because we don’t have a number from Facebook on how much Instagram made in 2014, we’ll go with Cowen & Co.’s projection of $700 million of revenue in 2015, divide it by the 300 million users that Instagram disclosed, and arrive at a revenue of $2.33 per user.
Yahoo has stayed largely silent about Tumblr’s financials since it acquired the social network. But the Wall Street Journal reported in October that Yahoo chief executive Marissa Mayer expects Tumblr to generate more than $100 million in revenue in 2015. Mayer also disclosed that Tumblr’s audience has grown to 420 million users, while the number of registered blogs nearly doubled to 206 million. She explained that her number for Tumblr’s users includes both logged-in users and people who land on one of its blogs. Because we don’t have a number for Tumblr’s 2014 revenue, we’ll use Mayer’s projection of $100 million in revenue for 2015, divide it by Tumblr’s 420 million users, and arrive at a revenue of $0.24 per user.
t’s easy to calculate a rough estimate for a social network’s revenue per user when companies disclose how many users they have and how much revenue they make each year. But some companies — including a few important social networks — don’t openly disclose that data. While Yahoo, for example, doesn’t disclose how much revenue Tumblr generates, some companies are even more secretive.
Take Pinterest. The New York Times reported that Pinterest was valued at $11 billion in March after a round of financing, a round that highlights “the investment world’s continuing infatuation with Pinterest.” But Pinterest doesn’t disclose how much it generates in revenue. It also doesn’t disclose how many people regularly use its social network. Estimates from eMarketer hold that Pinterest had 42.3 million users in 2014, and could reach 47.1 million users in 2015. The Wall Street Journal reported that Pinterest’s unique U.S. visitors reached an all-time high of 75.8 million in January, according to ComScore. Pinterest itself doesn’t disclose user numbers. VentureBeat reported that 80% of Pinterest’s traffic now comes from mobile devices.
Snapchat is another social media player where we’re short on data (though speculation abounds). Fortune reported in February that estimates put Snapchat’s user base at more than 100 million people. And in February, Bloomberg reported that Snapchat is seeking a round of funding that would value it at up to $19 billion. As Bloomberg noted at the time, Snapchat’s valuation has skyrocketed since it was founded in 2011. Chief executive Evan Spiegel turned down a $3 billion acquisition offer from Facebook in 2013 and raised funds at a $10 billion valuation last year. But we don’t know how much revenue Snapchat is really bringing in, especially with its advertising infrastructure in its infancy, so we can’t yet calculate how valuable the average user is to Snapchat.
Snapchat and other social media companies have recently received sky-high valuations, or achieved mind-boggling market caps — the dollar value of all of a company’s outstanding shares — which raises the interesting question of why these social networking companies are worth so much.
Even though Facebook’s total revenue in 2014 was $12.47 billion, its market cap is well over $200 billion. (And calculating your value to Facebook based on its market cap would make your value to the company about $143.88.) But there are some interesting theories about how this market phenomenon, which affects a variety of young tech companies, tends to play out.
Explaining how Snapchat planned to make money, Henry Blodget wrote for Business Insider about what’s he’s personally referred to as “Gurley’s Law,” a theory laid out by Benchmark venture capitalist Bill Gurley in a report on the valuation of a small but quickly growing tech company that was trading at a stratospheric multiple of earnings. “Gurley’s Law is this,” Blodget wrote, “At some point, every successful tech company will trade at a normal earnings multiple — say, 20X-25X earnings.” Blodget says that Gurley’s law doesn’t mean that a tech company trading at a multiple higher than 20X or 25X is overvalued, but when the company’s growth has slowed to a more mature rate, the multiples on the company’s stock will also be “normal.”
How many dollars of profit would Snapchat need to generate to justify Facebook’s $3 billion offer? Using Gurley’s Law, Blodget calculates that Snapchat would need to generate about $350 million of revenue to produce a profit of $120 million. He writes, “For Snapchat’s $3 billion valuation to be reasonable, you have to assume that Snapchat will some day generate, say, $500 million of revenue and $200 million of profit.”
Snapchat’s valuation has only gone up since Blodget made those calculations. But the company seems as if it is on its way to generating some real revenue. AdWeek reported in January that Snapchat is asking brands for $750,000 a day for ads — both “Snaps” that appear in users’ Recent Updates feeds and ad placements in the Our Stories live feed, which compiles users’ photos and videos of major events. And in March, Re/code reported that publishers on Snapchat Discover can command between $50,000 and $100,000 for ads placed alongside their content.
All of this is to say that social networks are nothing without their users, but the ways in which social media companies monetize their user bases can change rapidly. And a company’s success in putting expensive ads in front of you, or getting you to buy games, gifts, or premium services on its network, determines not just what it’s worth, but what you’re worth to the social network as well.

Friday, May 22, 2015

4 Negative Psychological Effects of Using Facebook Too Much


If you’re like many users of Facebook, the world’s largest social network, you continue to check in with your “friends” via Facebook’s website or app on a regular or semi-regular basis despite your misgivings about the good intentions of Facebook’s News Feed algorithm, the social network’s attentive collection of your data, or the number of cat videos and conspiracy theories you see in your News Feed.
Baby photos can get repetitive, political rants can grow tiresome, comments from people you never talk to get annoying, and watching all of your friends get married, have kids, or earn graduate degrees through the steady march of status updates and smartphone photos can wear on you when you’re less-than-satisfied with how your life is going. But when you close the browser or lock your phone, the low level of annoyance subsides, and you get back to your life. Right? According to an assortment of studies on the psychological effects of logging in to the social network, wrong.
Researchers at a number of academic institutions — plus at Facebook itself — have conducted an ever-increasing number of studies into how logging in to Facebook, scrolling through your News Feed, checking up on what your friends and acquaintances are doing, and posting your own photos and status updates on the social network affect how you feel about yourself and your life. And a lot of what they’ve found doesn’t bode so well for Facebook and for those addicted to checking in to the social network.
Researchers have found that using Facebook frequently is linked to symptoms of depression. They’ve proven that emotions, both positive and negative, spread easily via the posts users share on the social network. They’ve found that simply logging in to Facebook regularly negatively impacts how happy young adults are. And they’ve found that passive participation or feeling ostracized on the social network lead to negative psychological effects. Read on for the results of four of these studies — and then perhaps consider checking in to the social network a little less frequently, or taking it a little less seriously when you do.

1. Comparing yourself to your Facebook friends is depressing

The Washington Post reports that new research has drawn a connection between Facebook use and symptoms of depression, thanks to our tendency to compare ourselves and our lives to the images our “friends” project on the social network. The study, titled “Seeing Everyone Else’s Highlight Reels: How Facebook Usage is Linked to Depressive Symptoms” and published in the Journal of Social and Clinical Psychology, found that “The more time you spend on Facebook, the more likely it is for you to feel depressive symptoms,” according to lead author Mai-Ly Steers, a PhD candidate in social psychology at the University of Houston. “The underlying mechanism is social comparison. So essentially the reason you feel these feelings is that you tend to socially compare yourself to your friends.”
Steers and her coauthors completed two experiments with more than 100 subjects, measuring their Facebook usage, depressive symptoms, and their tendency to compare themselves with others. Spending a lot of time on the social network, or visiting it more frequently, was positively correlated with a tendency to compare oneself to others, which, in turn, is associated with increased depressive symptoms.
A lot of this likely has to do with social media users’ tendency to present their lives in the best light possible, leaving out the more mundane or disappointing details. “If you’re looking at your friends’ highlight reels, you might feel you don’t measure up, but that is a very distorted view,” Steers tells the Post. She adds, “If the images of our fabulous friend are causing us to feel more depressed, maybe we need to step away.”
Source: Thinkstock

2. Your mood is affected by what your Facebook friends post

As Vindu Goel reported for The New York Times last summer, Facebook revealed that it manipulated the News Feeds of more than half a million unsuspecting Facebook users to alter the emotional content of the posts that they saw. It did so to study whether and how emotions can be spread on social media. The study, published in the Proceedings of the National Academy of Sciences and titled “Experimental evidence of massive-scale emotional contagion through social networks” (PDF), revealed that Facebook had altered the number of positive and negative posts in the News Feeds of 689,003 users to see what effect the changes had on the tone of the posts those users then wrote.
The researchers found that moods were contagious; the users who saw more positive posts wrote more positive posts, while those who saw more negative posts were more negative in their own posts. The study highlighted the degree to which Facebook controls the content its users see, with the algorithm that populates the News Feed playing a decisive role in choosing which of all of the potential posts will actually end up in front of a user.
While Facebook maintained that users consent to this kind of experimentation when they agree to its terms of service, the Internet was quick to pass judgment on the social networking giant. Many regarded the study as unethical, if not strictly illegal, even as others pointed out that Facebook is hardly the only tech company to manipulate aspects of a product’s user experience and analyze how users respond. And the study seemed to clearly violate the principles of academic and psychological research, even as the researchers behind the study presented their findings as social science.

Source: Thinkstock
Source: Thinkstock

3. And Facebook itself probably doesn’t help your mood

Two years ago, Elise Hu reported for NPR that a study conducted by researchers at the University of Michigan found that the more frequently young adults used Facebook, the worse they felt. The study, published in the PLOS ONE journal, found that Facebook usage led to declines in both moment-to-moment happiness and overall life satisfaction among college-aged adults.
Researchers tested the variables of happiness and satisfaction in real time on 82 participants, text-messaging them five times per day for two weeks to find out how Facebook use influenced the way they felt. The participants responded to questions about loneliness, anxiety, and general emotional wellbeing. While the study didn’t deeply investigate why Facebook made users sadder and less satisfied, coauthor John Jonides pointed to social comparison as a possibility.
“When you’re on a site like Facebook, you get lots of posts about what people are doing. That sets up social comparison — you maybe feel your life is not as full and rich as those people you see on Facebook,” he told NPR. The study found that Facebook’s negative effects were most pronounced for users who socialize the most in “real life,” with those who did the most face-to-face socializing reporting the most dramatic Facebook-related mood decline. But the solution, the researchers found, was simple enough: direct interactions with other people, either face-to-face or over the phone, led participants to feel better.

Source: Thinkstock

4. Lurking or feeling ostracized on Facebook hurts your self esteem

Science Daily reported last year that a study published in the journal Social Influence, called “Threats to belonging on Facebook: lurking and ostracism,” found that a lack of active participation on the social network negatively impacts users’ wellbeing and their perception that their lives are meaningful.
The researchers conducted two experiments to examine the effects of lurking and ostracism, which they identified as to threats to a sense of belonging on a social network like Facebook. In the first study, participants were either allowed or not allowed to share information on Facebook for 48 hours. Those who weren’t allowed to share had lower levels of belonging and “meaningful existence.”
In the second study, the researchers simulated a version of Facebook where half of the participants’ profiles would not receive any feedback on status updates. The participants who didn’t receive feedback had lower levels of belonging, self esteem, control, and meaningful existence, and the researchers concluded that passive Facebook participation or feeling ostracized on the social network have a negative impact on users’ wellbeing.